District aquifer mapping in 3D
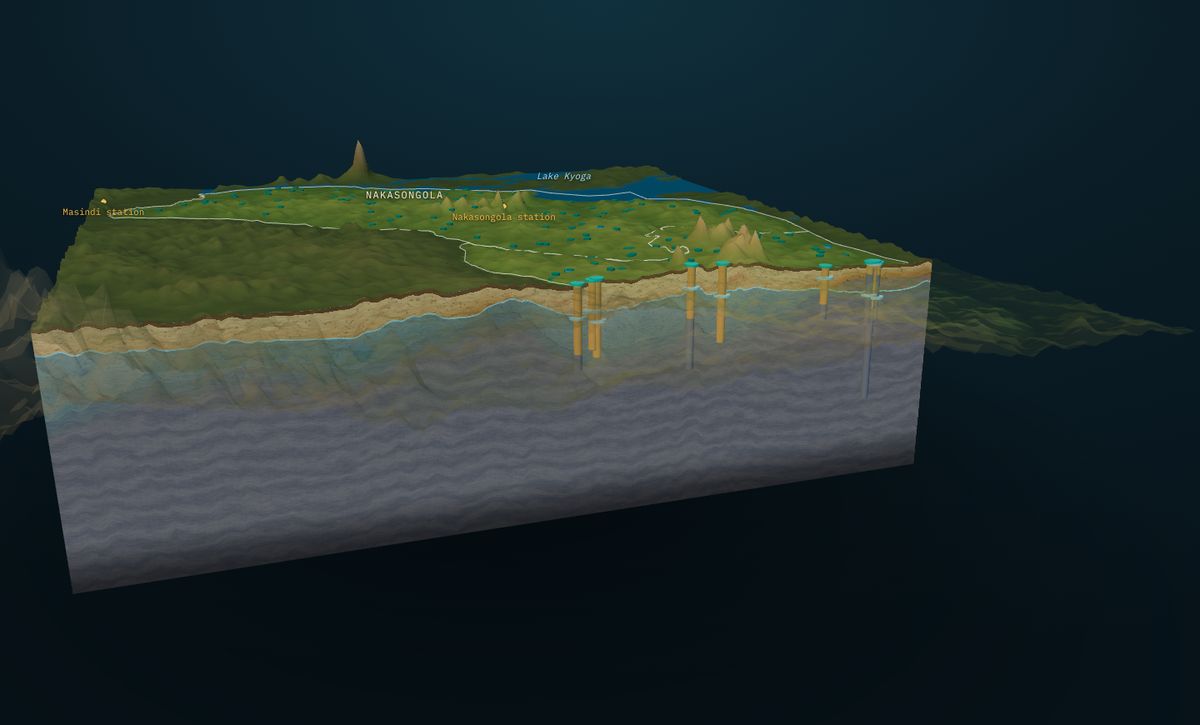
A living 3D model of the aquifer under a district or wellfield.
Water plans are made district by district, but the groundwater picture is usually a few scattered reports and a borehole register. Nobody can see at a glance where the water is shallow, where it is deep, and where there is no data at all.
Our solutionGroundWater Analyst builds a 3D model of the aquifer for the whole area: soil, regolith, the saturated zone, weathered rock and bedrock, with every borehole drawn in and groundwater flow animated on the water table. It runs in a browser, so planners, engineers and partners all look at the same thing.
The model is updated as new boreholes are drilled, and every surface can be downloaded for GIS.
Who it is for: District and town water authorities, utilities, development programmes
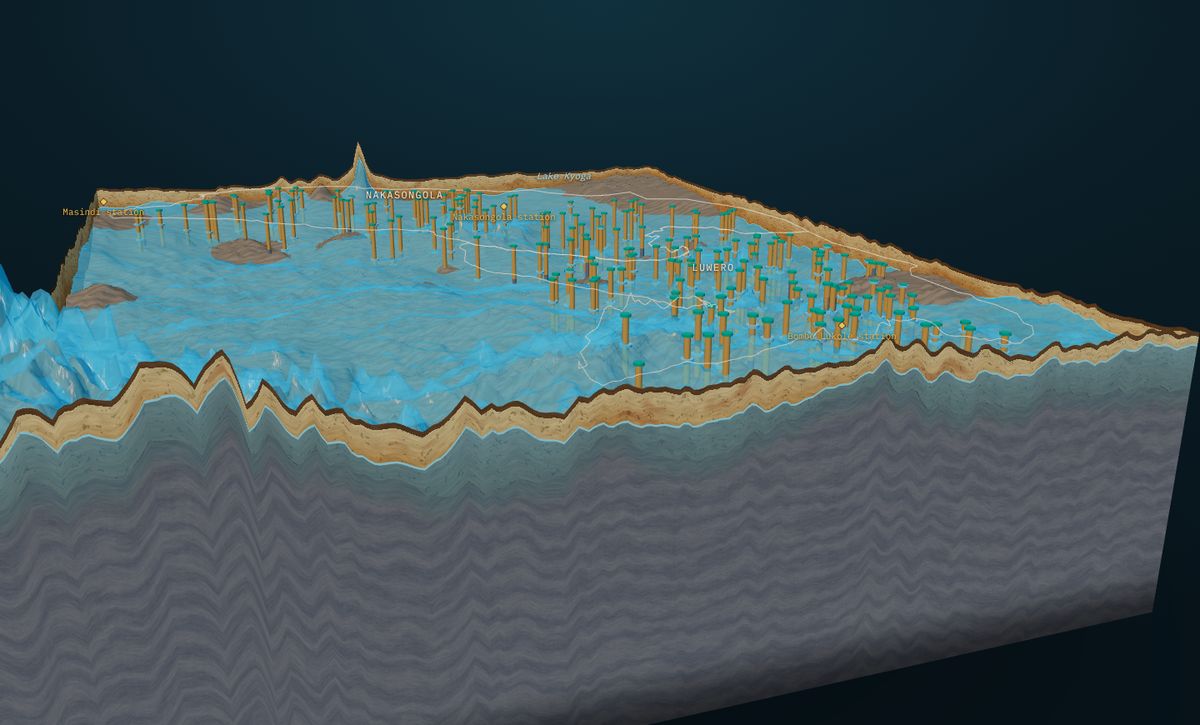
- One shared picture for planners and partners
- Data gaps made visible, so new boreholes fill them
- Depth maps for budgeting drilling programmes
- Kept current as new records arrive
How it works, step by step
Records
Borehole logs and water levels, from you or licensed from the data owner.
Clean
Quality control and georeferencing.
Terrain
A digital elevation model sets the ground surface.
Interpolate
Water table and bedrock on a regular grid.
Build
The 3D aquifer block, sections and flow.
Publish
A private link, maps and a short report.
What powers this solution
Interested in district aquifer mapping in 3d?
Contact our team today, or start in the KAI portal.